
Finance function / Month-end pack
The work behind a month-end pack
Five pages from an illustrative firm's management, board and lender packs. Each says what the numbers mean and what happens next, and each depends on work the reader never sees.
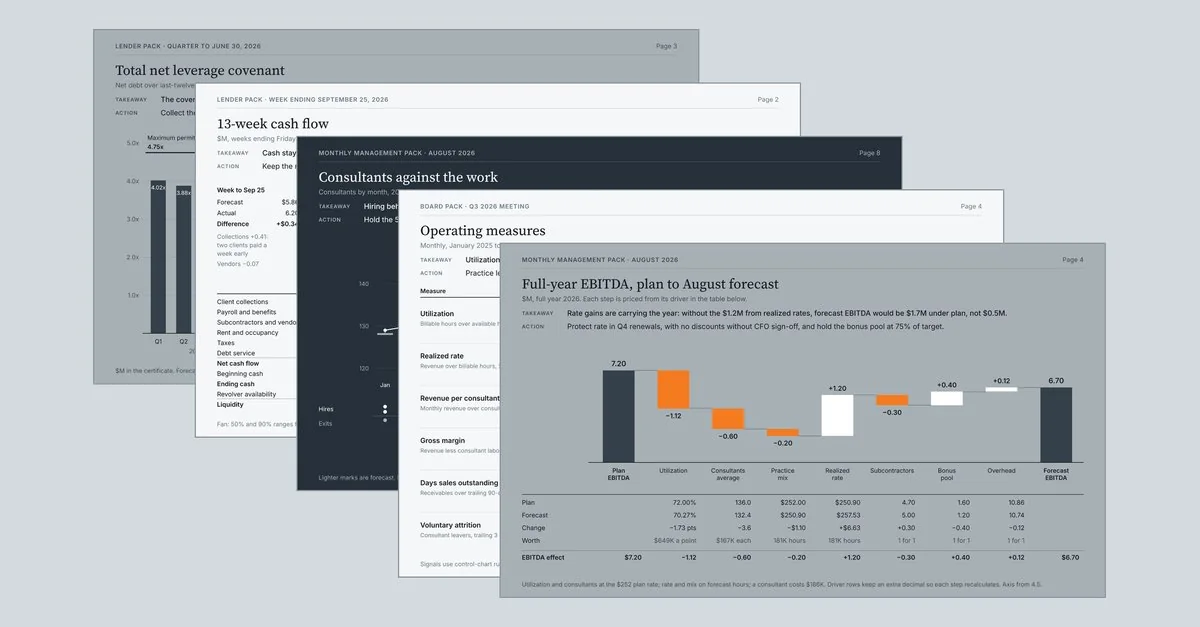
In April last year I wrote in my newsletter, The Barefoot Back Office, that “If your dashboard can't help you act, it's not a KPI. It's a scoreboard.” A lot of month-end and board packs have the same problem. Every number is there and it all ties out, but the reader is left to work out what it means and what anyone is going to do about it.
Over the past few weeks I've been working through sixteen standard finance pages of the kind a PE-backed consulting firm produces: a monthly management pack, a quarterly board pack and the lender reporting that sits alongside them. The firm is illustrative. It has about 135 consultants. The numbers are invented, but they're built to hold together the way a real firm's would. Every page carries two lines under its title. The takeaway is a judgment, not a restatement of the numbers. The action names a lever, an owner and a date.
Those two lines are where most packs fall short. Plenty of finance teams have the data, and many have some version of the model. What's missing is a page that says what the numbers mean and what someone is going to do about it. Getting there still takes more hours underneath than on the page, and you can't skip that work. So for each of the five pages below, I've noted what has to exist behind it.
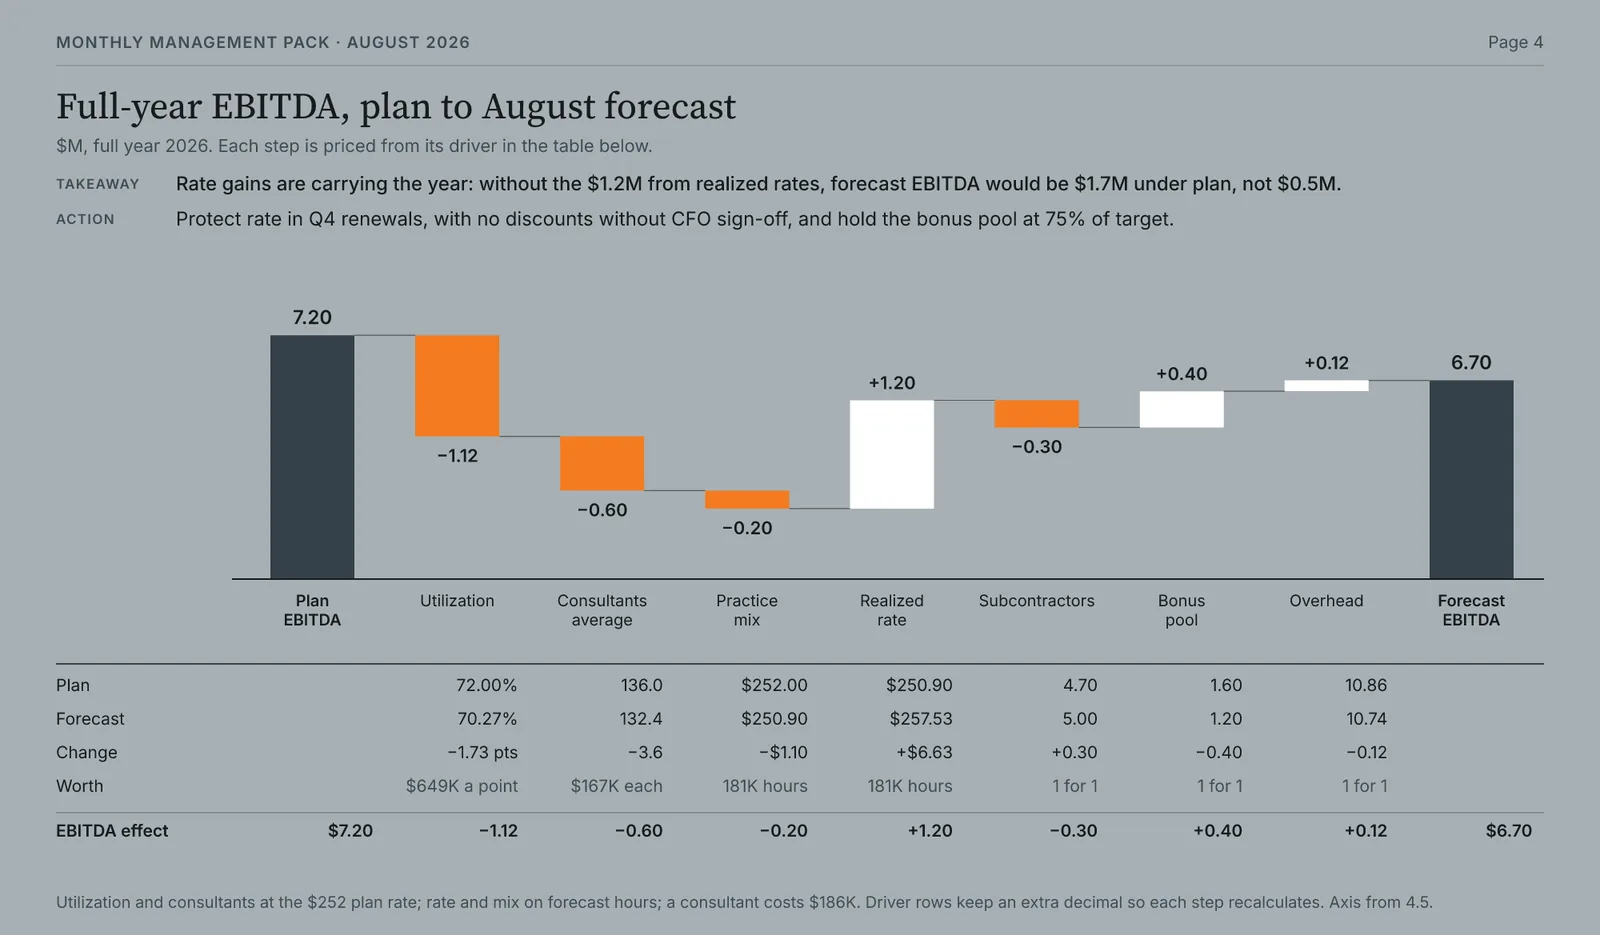
The first is the EBITDA bridge, because it tells the whole year in one story. The full-year forecast is $0.5M below plan. Instead of one bar for volume, one for price and one for everything else, each step is priced from its driver:
- Utilization is forecast 1.7 points under plan, at about $649K a point.
- The firm will average 3.6 fewer consultants than planned, at about $167K each.
- Realized rates are $6.63 an hour above plan across 181,000 hours, which is worth $1.2M.
That last step changes the story. Without it, the forecast would be $1.7M under plan, not $0.5M. Rate is carrying the year, and the action follows from that: protect rate in the fourth-quarter renewals, with no discounts without CFO sign-off. Most bridges have a plug where the math should be. Avoiding one takes a driver model with hours, rates and headcount by practice, built at the same grain as the plan, so every variance has somewhere to go.
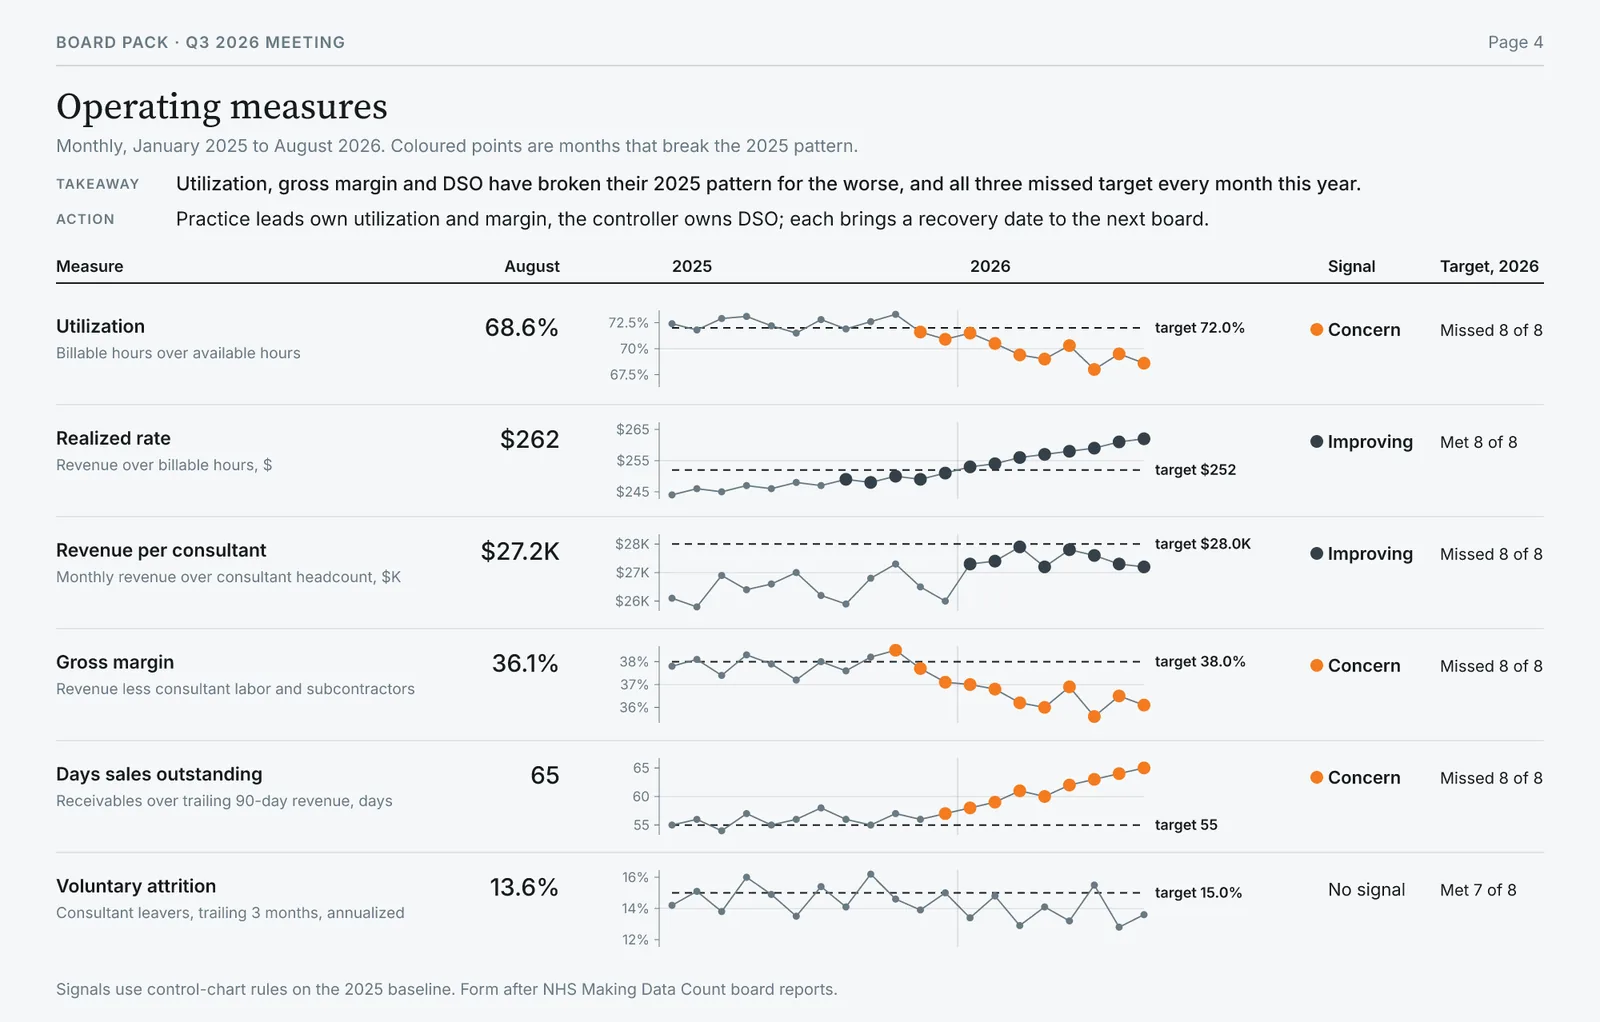
The second page drills into the measures behind the bridge. Each one is plotted monthly from January 2025 against the pattern it held through 2025, so a real shift stands out from ordinary month-to-month noise. Three have broken that pattern for the worse:
- Utilization has fallen from around 72% to 68.6% in August.
- Gross margin has fallen from around 38% to 36.1%.
- Days sales outstanding has risen from the mid-fifties to 65.
All three have missed target every month this year. Realized rate has moved the other way, to $262 an hour against a target of $252. That's the same story as the bridge, seen month by month. The action gives each problem an owner. Practice leads take utilization and margin, and the controller takes DSO. Each brings a recovery date to the next board. Behind that page, each measure has to be defined once and calculated the same way every month, with at least a year of history to set the baseline.
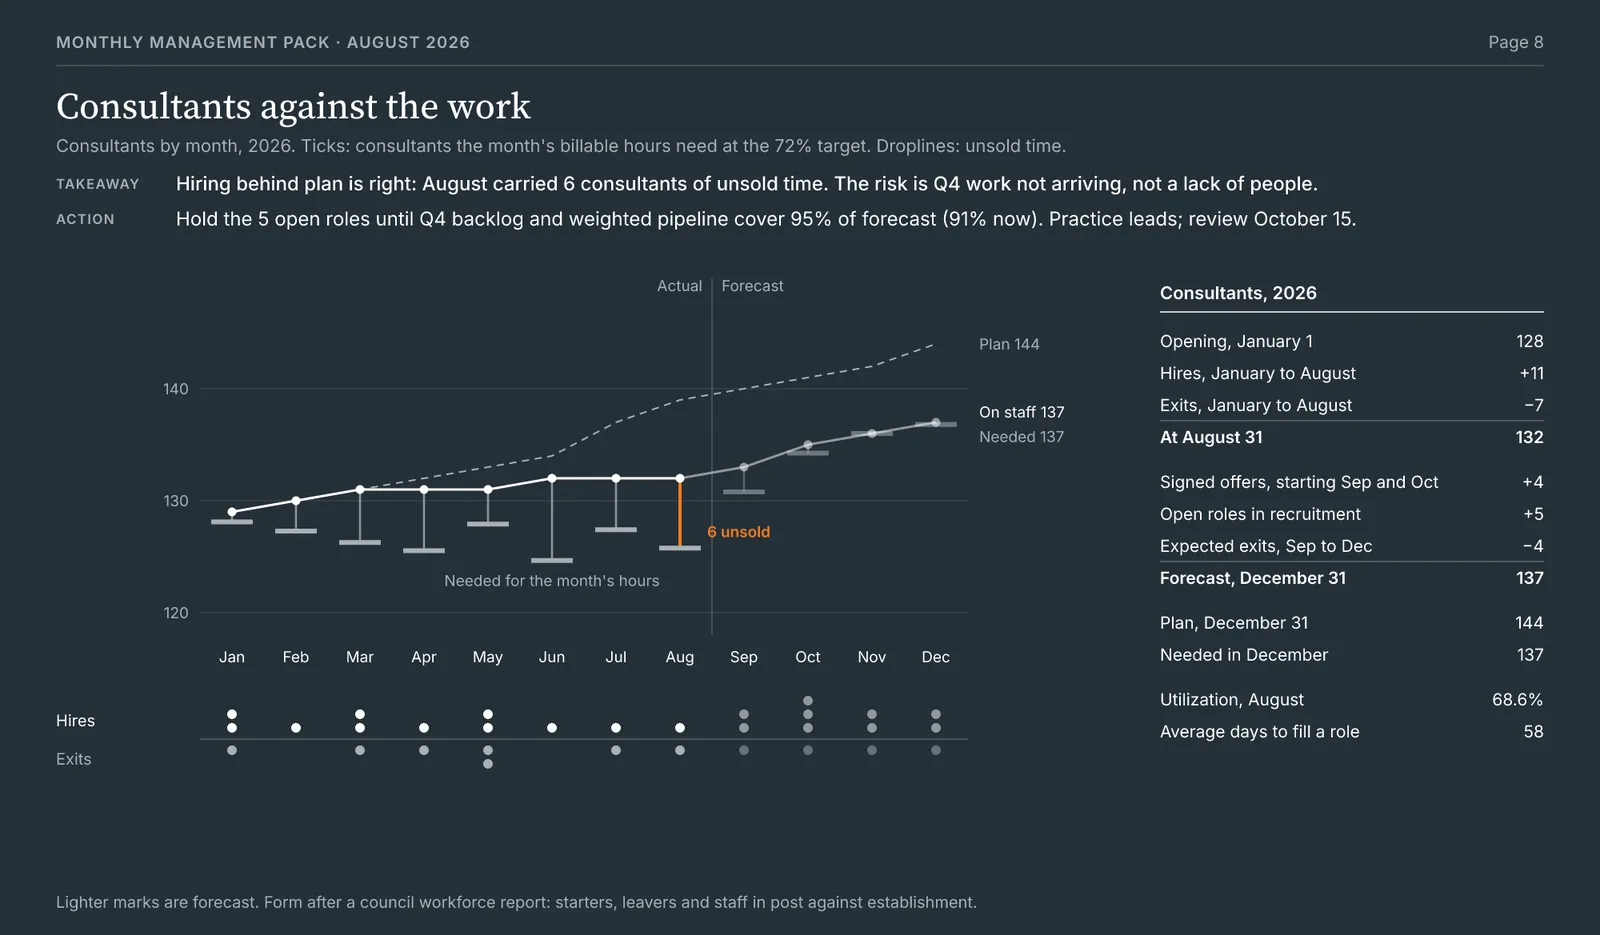
The third is headcount, the consultants step in the bridge. With utilization down, the obvious question is whether the firm has the right number of people. It is hiring behind plan, with 137 consultants forecast for December against a plan of 144. The instinct is to read that as a staffing problem. The page compares the consultants on staff with the consultants each month's hours actually needed. In August the firm carried six consultants' worth of unsold time, so hiring behind plan was the right call. The action is to hold the five open roles until backlog and weighted pipeline cover 95% of the fourth-quarter forecast; today they cover 91%. That page depends on two things. The headcount requirement has to be calculated from forecast hours rather than typed in, and the pipeline has to be weighted and set against capacity.
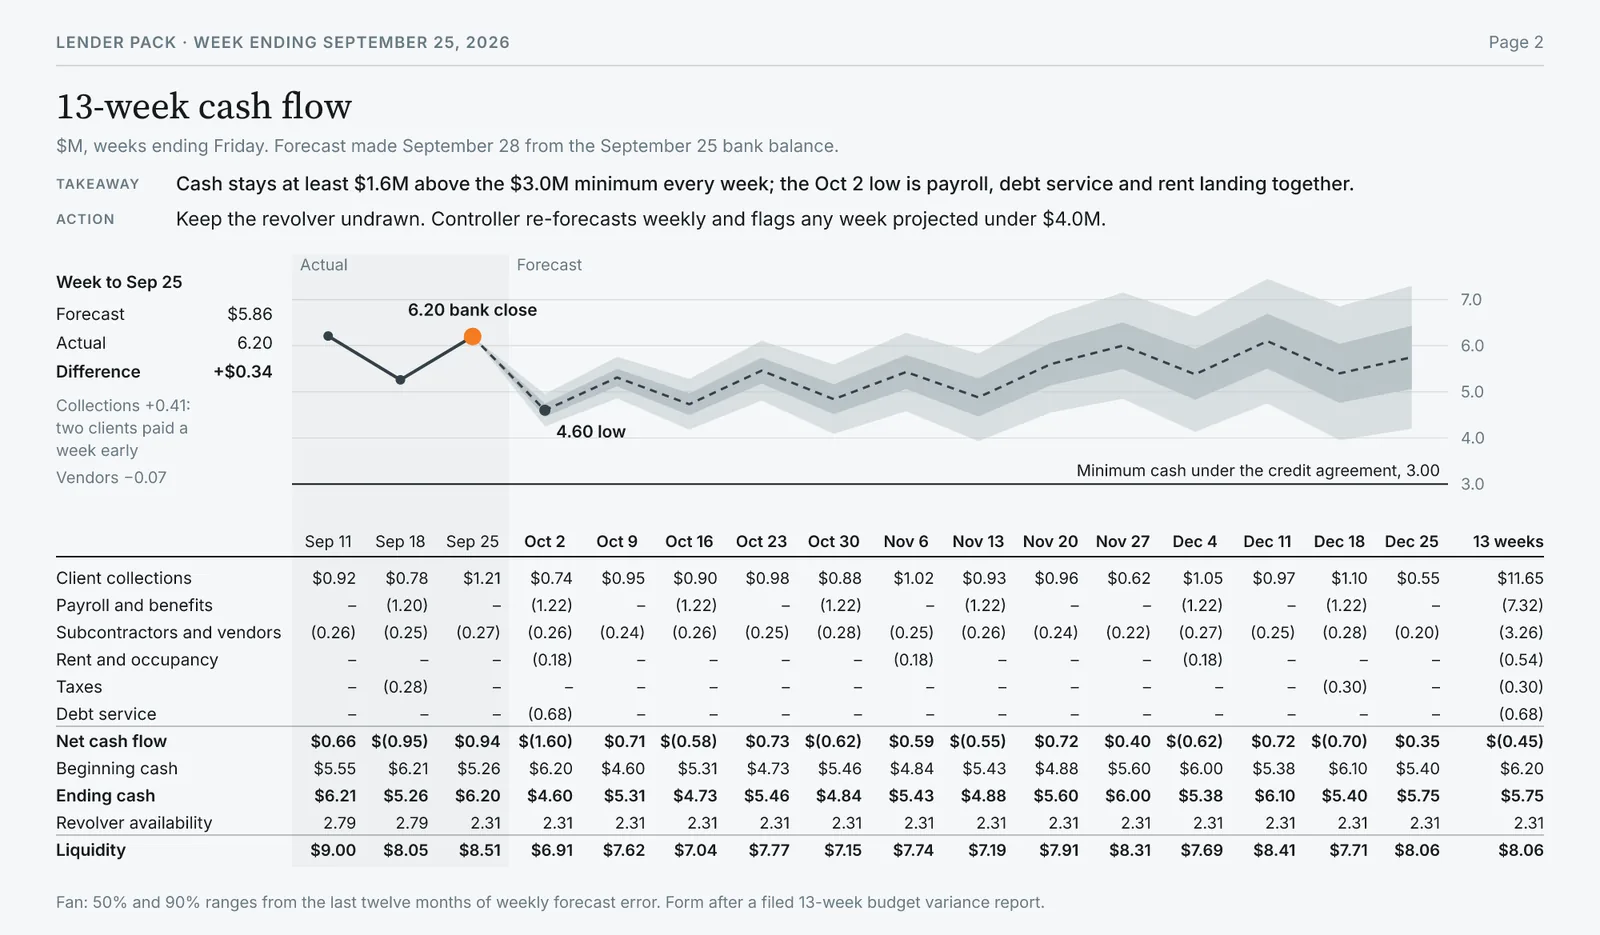
The fourth is the 13-week cash forecast. Cash stays at least $1.6M above the $3.0M minimum every week. The low point, in the week ending October 2, comes from payroll, debt service and rent landing in the same week, not from a trend. The action is to keep the revolver undrawn, with the controller re-forecasting weekly and flagging any week projected under $4.0M. The shaded range around the forecast is the part most teams can't draw. It comes from the last twelve months of the firm's own weekly forecast error, so it shows how accurate this team's forecasts have actually been. That needs a weekly forecast built from scheduled receipts and payments, and a record of every past forecast kept so it can be compared with what happened.
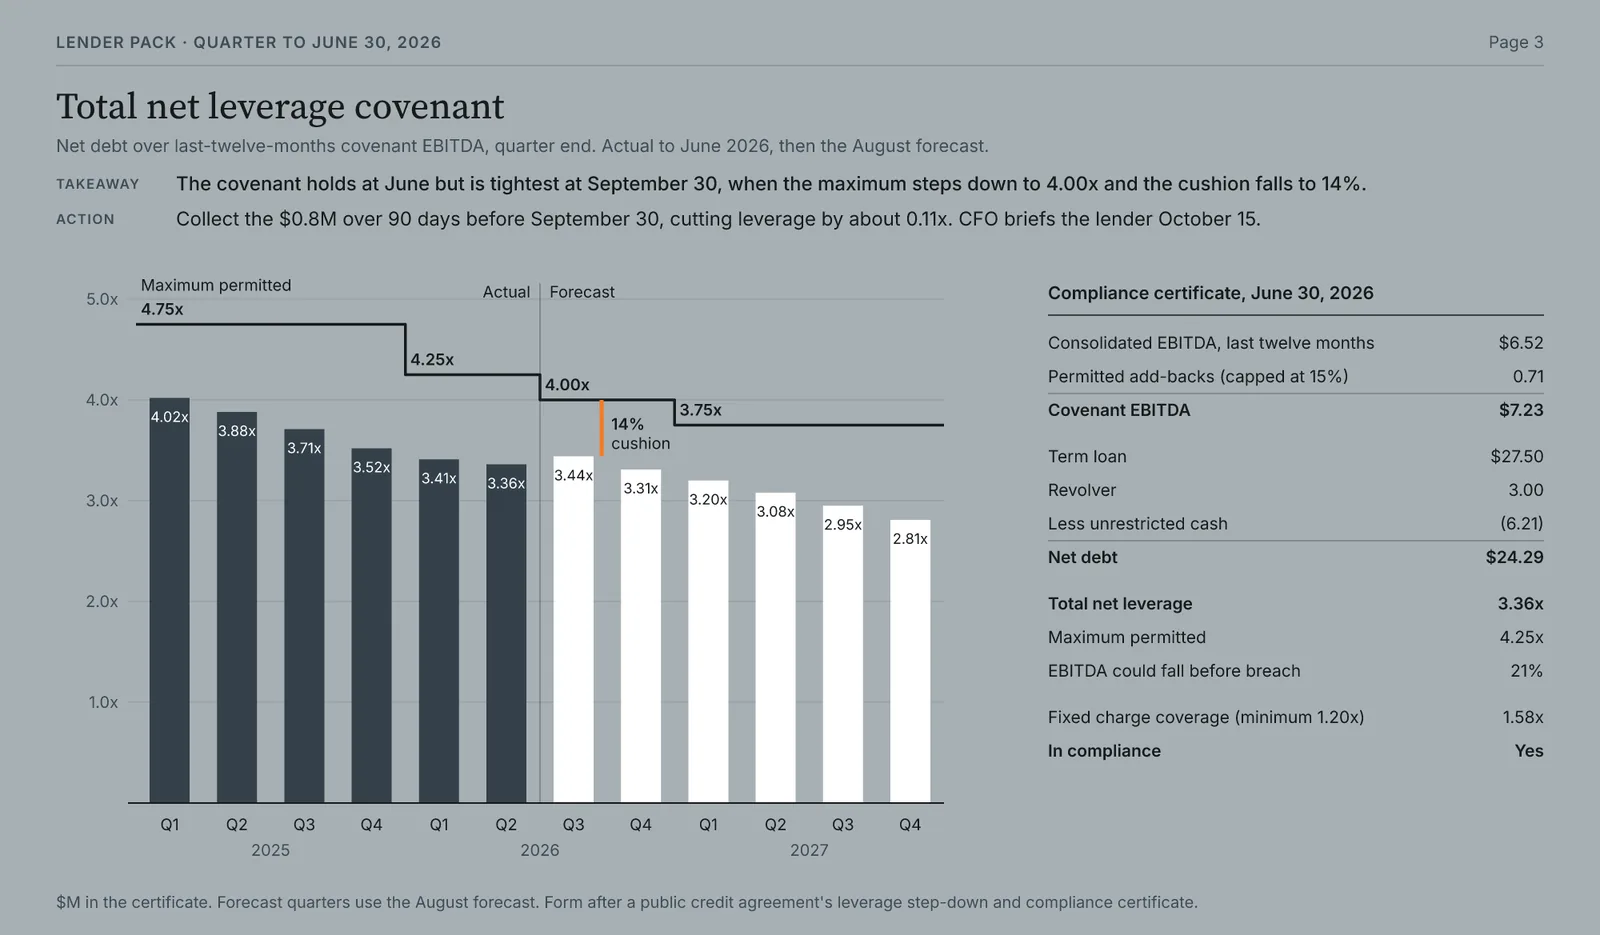
The fifth is the leverage covenant, where the rising DSO from the second page comes back. The covenant passes at June 30, but the page looks ahead to September 30, when the maximum steps down to 4.00x and the cushion falls to 14%. The action is concrete: collect the $0.8M of receivables more than 90 days old before the test date, which takes about 0.11x off leverage, and have the CFO brief the lender in mid-October. Seeing that three months out requires the covenant definitions to be calculated every month from the ledger and the receivables aging, not once a quarter when the compliance certificate is due.
The action lines are the part a model can't write. “Re-forecast at the trailing three-month run rate” is a reasonable change, but it's mechanical. It doesn't solve a problem or move anything forward. “Collect the over-90 receivables before the covenant steps down” does. An action like that comes from a conversation with the person who owns the lever, before the pack goes out. Finance can draft it, but the owner has to agree to it.
The last thing is the hardest to see on any single page: the numbers tie.
- The last-twelve-months EBITDA in the lender's coverage ratio is the same $7.23M that drives the leverage covenant.
- The $0.8M of old receivables in the covenant action is the same $0.8M the controller is asked to collect on the working capital page.
- Average headcount in the EBITDA bridge comes from the same monthly headcount as the staffing page.
That only happens when one model sits under the whole pack. When each page comes from its own spreadsheet, management, the board and the lender end up looking at slightly different versions of the same firm.
Most of the hours go into what sits underneath: a driver model, a plan at the right grain, covenant calculations that run every month, and conversations with the people who own the levers. You can't produce pages like these without that work. But that work isn't where most packs stop. Plenty of teams have done a good part of it and still send a scoreboard, because nobody takes the last step of saying what the numbers mean and what will be done about them. So I'd ask two questions of any pack. Does every page tell the reader what it means and what happens next? And could your team produce it from your systems by the fifth business day?
If your pack is a scoreboard today, the practical next step is to look at one month-end together. Bring this question